An exhibition showcasing the visualization of complex data in innovative and eye-catching ways will be on display at four campus locations beginning Monday, Jan. 23.
Places & Spaces: Mapping Science is an international collection of data visualizations that use groundbreaking methods to make sense of large data streams. Works from the exhibition will be on view in Vanderbilt’s Sarratt Student Center, Rand Hall, the Wond’ry, and the Jean and Alexander Heard Library.
“The Places and Spaces exhibition embodies a key tenet of Vanderbilt’s Academic Strategic Plan,” Associate Provost for Digital Learning John M. Sloop said. “The Education Technologies pillar of the plan compels us to transform education models through technology and research, and Places and Spaces is a unique example of this philosophy. [rquote]The university is proud to embrace the new education technologies modeled by the exhibition—technologies that span across disciplinary boundaries and foster innovation in learning, teaching and discovery.”[/rquote]
For more than a decade, the Places & Spaces exhibition has collected science maps and visualization tools from leading experts in the natural, physical and social sciences as well as from industry and government. By helping viewers grasp the abstract concepts, relationships and dynamism of complex systems, the exhibition promotes more informed, effective decision-making on the part of private individuals, industry practitioners, public policymakers and others. The exhibition is curated by Indiana University’s Cyberinfrastructure for Network Science Center and has traveled to 28 countries on six continents. It showcases the work of 235 mapmakers who hail from 68 cities in 16 different countries.
An interdisciplinary and international advisory board chose each work in the Places & Spaces exhibition as an outstanding example of how visualization can bring patterns in scientific data into focus. Each year new visualizations are added, ranging from early maps showing the terrain of science to maps showing the national mood through tweets over the course of a day. The exhibition touches on subject matter as diverse as polar bear habitats, forecasting epidemics, and the settings of Victorian poems. The exhibition includes 100 science maps, sculpture, hands-on activities, and interactive visualizations called macroscopes. Four new macroscopes have been chosen to travel with the exhibition and will make their debut at Vanderbilt.
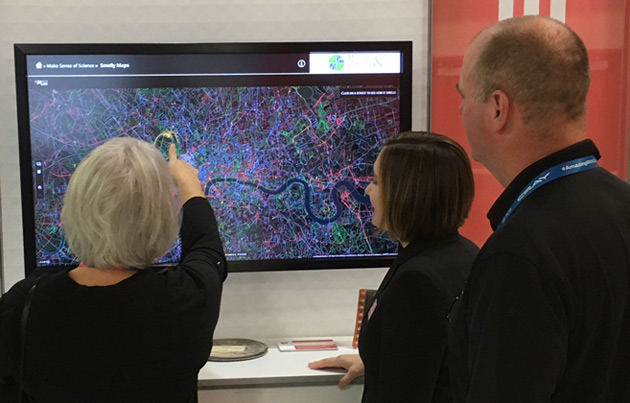
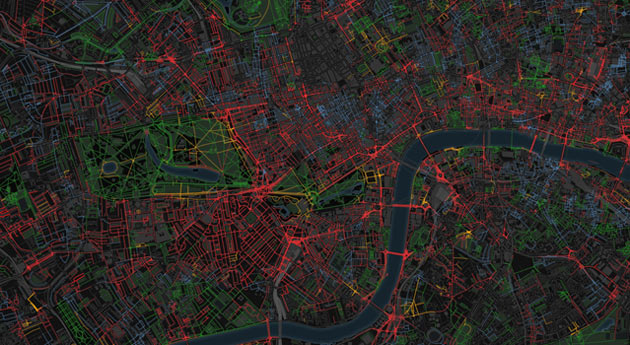
These four macroscopes use data that varies greatly in terms of subject matter and method of collection: city smells found on social media, a library collection mapped in time and space, institutional partnerships revealed through publications, and ship locations tracked by satellite. However, they all present data visually to encourage new perspectives. Visitors are invited to touch the data and engage with the macroscopes at a touchscreen kiosk. The Vanderbilt macroscopes are as follows:
- Smelly Maps—participants can find out what a smellscape is and see how 12 cities were mapped by smell using social media
- HathiTrust—participants can explore the diversity of publications collected in digital form by HathiTrust
- Excellence Networks—participants can compare how research institutions such as Vanderbilt collaborate with one another
- FleetMon Explorer—participants can see how much shipping traffic navigates the Strait of Malacca as compared to the other major shipping lanes of the world
In addition, Katy Bӧrner, curator of the exhibition and a distinguished professor of information science at Indiana University, will deliver a keynote lecture at 3 p.m. in conjunction with the exhibit’s opening Friday, Jan. 27, in the Community Room of the Jean and Alexander Heard Library, followed by a reception. The event is free and open to the public.
“The Jean and Alexander Heard Library is honored to host Places & Spaces and to welcome its curator to our library,” University Librarian Valerie Hotchkiss said. “[lquote]This is a great example of the way the Vanderbilt Libraries support research and learning with both traditional resources and cutting-edge tools.”[/lquote]
“In the information age, being able to ‘read and write’ data visualizations is becoming as important as being able to read and write text,” Bӧrner said. “The visualizations displayed in this exhibition showcase the power of data visualizations to save lives, to make decisions informed by high-quality data, and to communicate the beauty and value of science to a general audience.”
The exhibition at Vanderbilt is funded by the Wild Bunch Fund, established in 1997 to honor late Chancellor Emeritus Alexander Heard and his wife, Jean Heard. The fund was started by seven former Vanderbilt student leaders who called themselves the “Wild Bunch.” The group formed in 1973 when Heard extended an open invitation to the freshman class to meet for lunch. Those who attended went on to develop strong friendships with each other and Heard over the years, long past graduation. Income from the endowment is also used to purchase library materials. For additional information about the Wild Bunch Fund, please contact Celia Walker at celia.walker@vanderbilt.edu.